From One-Time Purchase to the Monthly Bill
When Apple launched the App Store in 2008, the dominant business model was simple: charge once, keep the money. Games sold for $0.99, utilities for $4.99, and the platform took its 30% on every transaction. The model suited the novelty of the moment. It did not survive contact with the economics of mobile scale.
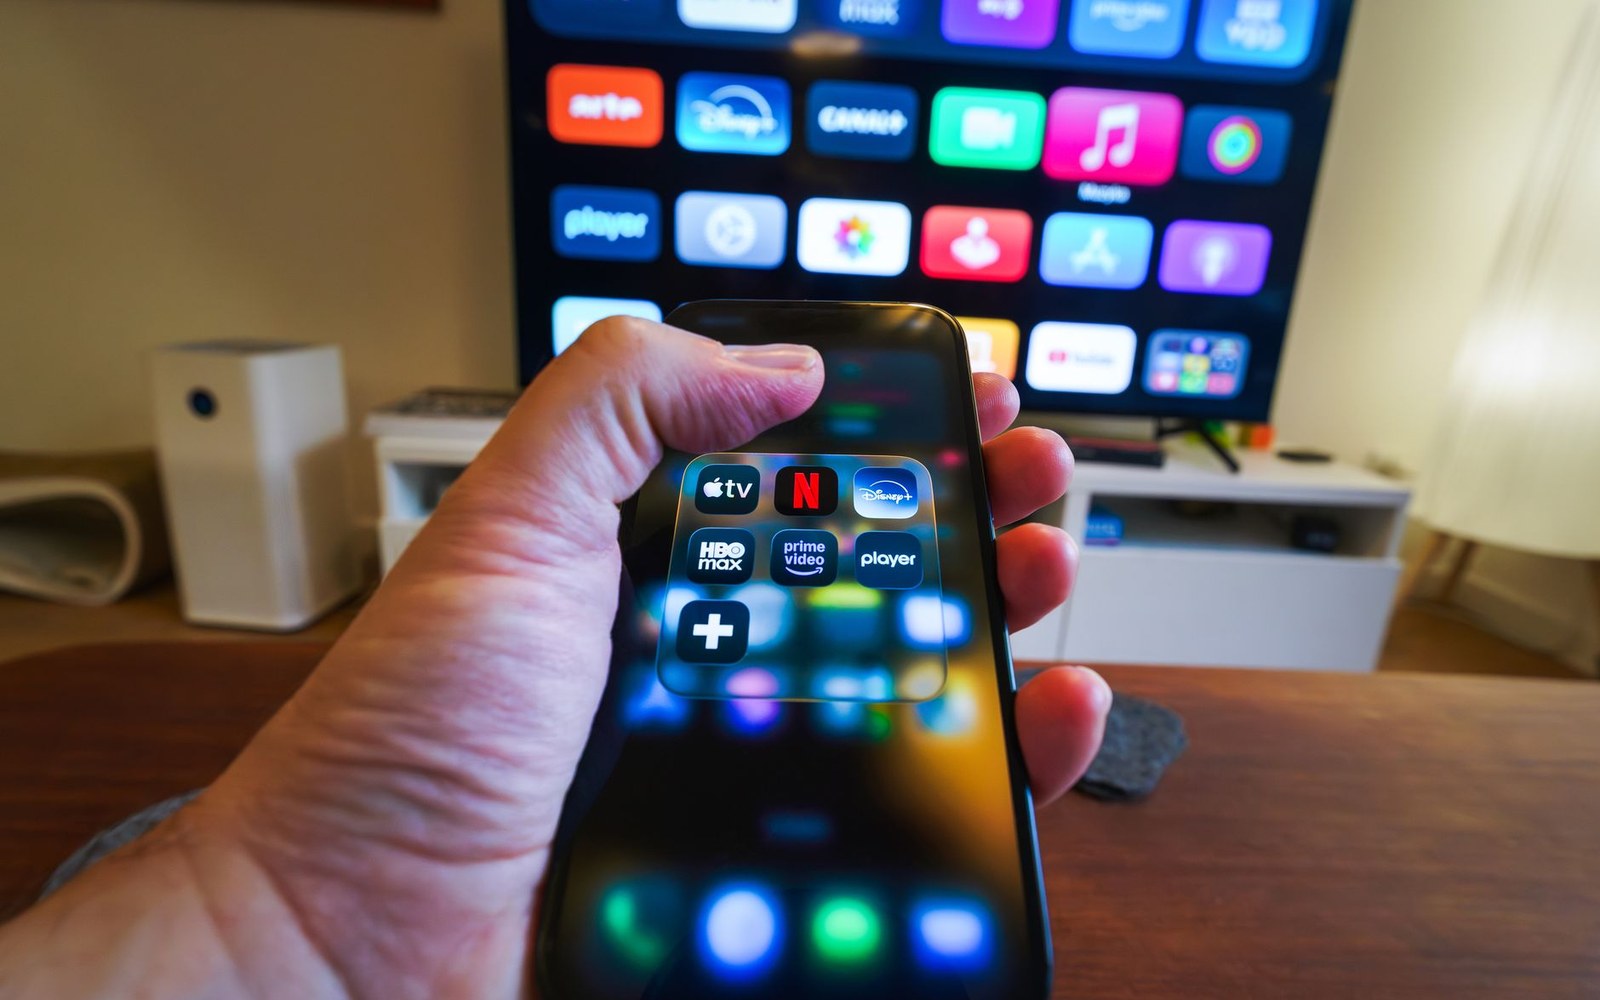
The shift toward subscriptions accelerated through the mid-2010s, and by the early 2020s it had become the structurally dominant revenue form. Sensor Tower's 2023 State of Mobile report, covering full-year 2022 data, found that subscription-based apps accounted for the majority of consumer spending on both the App Store and Google Play, with the entertainment, productivity and health-and-fitness categories leading the conversion away from one-time purchases. Appfigures data published in early 2024 showed that subscription apps represented roughly 95% of the top-grossing apps on the US App Store by revenue, a proportion that would have been unrecognisable in 2012.

The paid-upfront model did not disappear — it persists in premium games and certain professional tools — but its share of aggregate store revenue has become marginal. In-app purchase spending on consumables, particularly in mobile gaming, remains large in absolute terms, though even that segment has seen subscription wrappers layered on top, with battle-pass mechanics and monthly currency bundles blurring the boundary between the two models.
The Commission Differential That Drives the Chart
The shift is not purely consumer preference. It is partly engineered by the commission structures Apple and Google adopted in 2016 and formalised more broadly through their small-business programme reforms.
Both platforms charge their standard 30% commission on initial subscription payments. After a subscriber has remained continuously subscribed for twelve months, that rate drops to 15%. The reduction applies automatically and does not require any developer action beyond enrolling in the standard subscription product type. For a developer operating at scale, the difference between 30% and 15% on a multi-year subscriber cohort is the difference between a viable and an unviable unit of economics.
Chronology
- 2008App Store launches; paid-upfront is the primary revenue model
- Mid-2010ssubscription model begins to displace one-time purchases across categories
- 2016Apple introduces 15%-after-year-one subscription commission; Google follows in 2018
- 2022Sensor Tower State of Mobile report documents subscriptions as majority of consumer spending on both stores
- Early 2024Appfigures data shows ~95% of top-grossing US App Store revenue from subscription apps
The practical consequence is that developers with high subscriber retention — streaming services, productivity tools, dating apps, language-learning platforms — benefit disproportionately from the year-two rate. The 15% tier creates a financial incentive to optimise for retention over acquisition, and the top-grossing charts now reflect that: the apps that consistently appear at the top are almost without exception subscription businesses with mature, retained audiences.
Match Group's portfolio, including Tinder; YouTube Premium; and a range of productivity apps including Microsoft 365 and various small-developer tools each routinely occupy the top-grossing positions on both platforms in major markets. Their ranking is not chiefly a function of download volume — that metric appears elsewhere in the charts — but of recurring billing at scale.
What the Numbers Stopped Measuring
The dominance of subscriptions has also complicated the measurement of the app economy itself. Sensor Tower and data.ai both publish estimates of consumer spend that aggregate across purchase types, but the recurring nature of subscription billing means that a single converted user in year three of a subscription generates revenue that looks identical in the aggregate to three separate one-time purchasers. Consumer spending estimates derived from store data therefore capture stock — the installed base of active subscribers — rather than flow, which is what a download-era chart represented.
The commission arithmetic makes the stakes concrete: on a $9.99 monthly subscription held for three years, a platform collects approximately $36 in the first year at 30% and then roughly $18 per year thereafter at 15%. The developer's effective commission rate across the full three-year relationship falls to about 20%. At the hundreds of millions of subscriptions that now run through the major stores, the aggregate transfer from developers to platforms — and the portion that stays with developers — is measured in tens of billions of dollars annually.
Key numbers